What 3,927 reviews of 44 feedback tools say teams love and hate (2026 research)
We analyzed a collected sample of public reviews of 44 feedback, bug reporting and feature request tools. Here’s what people praise, what they complain about, and how that changed.
Short answer: teams praise feedback tools that are easy to use (18% of reviews), connect to the tools they already use (11%) and work for clients and non-technical people (10%). The most common complaints are missing features (18%), a learning curve (11%) and bugs or reliability (10%). Complaints about the learning curve rose from 11% of reviews written in 2022 or earlier to 18% of reviews written from 2024 to 2026.
Key findings
- Ease of use is the most praised quality, mentioned in 18.0% of reviews, ahead of integrations (11.1%) and working well for clients and non-technical people (9.8%).
- Learning curve complaints are rising: 10.7% of reviews from 2022 or earlier, 18.1% of reviews from 2024 to 2026.
- Mobile complaints are growing too: from 3.0% to 4.9% over the same periods, and slowness from 4.6% to 7.0%.
- Mobile bug reporting tools draw the most reliability complaints: 24.7% of their reviews mention bugs or reliability, more than double website feedback tools (11.4%).
- Feature request tools draw the most “missing feature” complaints: 26.8% of their reviews.
- Overall satisfaction is high: the average rating is 4.4 out of 5, and only 8.0% of ratings are 3 or lower. Read the complaints as what to check during a trial, not reasons tools fail.
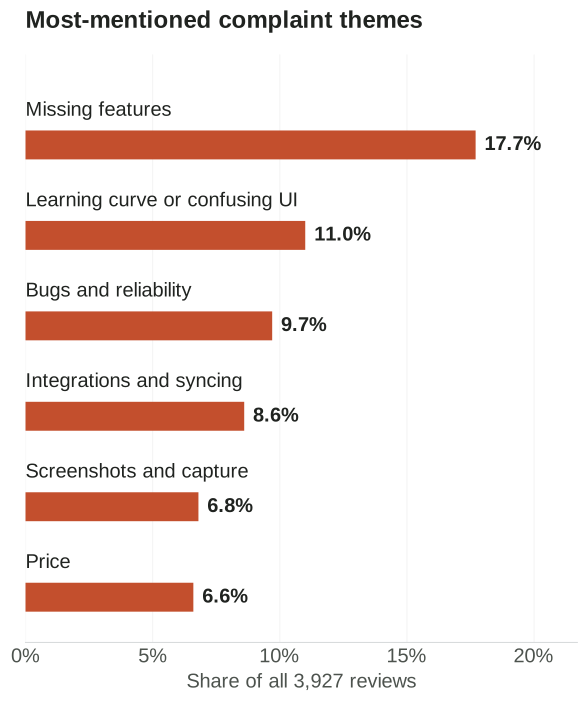
What people complain about
| Complaint | Share of all reviews |
|---|---|
| Missing features | 17.7% |
| Learning curve or confusing interface | 11.0% |
| Bugs and reliability | 9.7% |
| Integrations and syncing | 8.6% |
| Screenshots and capture | 6.8% |
| Price | 6.6% |
| Reporting and tracking | 6.0% |
| Customization limits | 5.2% |
| Slowness | 4.8% |
| Mobile support | 3.3% |
| Too many notifications | 2.9% |
| Support quality | 2.2% |
| Browser extension | 1.3% |
| Friction for clients and guests | 1.2% |
What people praise
| Praise | Share of all reviews |
|---|---|
| Easy to use | 18.0% |
| Integrations with other tools | 11.1% |
| Works for clients and non-technical people | 9.8% |
| Collaboration and less back and forth | 6.2% |
| Screenshots and visual markup | 6.1% |
| Everything in one place | 5.8% |
| The support team | 3.6% |
By type of tool
| Type of tool | Reviews | Average rating | Most common complaints |
|---|---|---|---|
| Website feedback and annotation | 1,362 | 4.42 | Missing features 15.3%, bugs 11.4%, screenshots 10.1% |
| Mobile bug reporting and crash | 453 | 4.41 | Bugs 24.7%, missing features 15.0%, price 13.2% |
| Feature requests and roadmaps | 537 | 4.38 | Missing features 26.8%, learning curve 17.3%, integrations 16.0% |
| Surveys and in-app feedback | 672 | 4.30 | Missing features 12.8%, learning curve 8.0% |
| Session replay | 140 | 4.67 | Missing features 20.0%, screenshots 17.9% |
| Creative proofing | 755 | 4.43 | Missing features 21.3%, learning curve 17.7%, slowness 10.3% |
Comparing the collected review periods
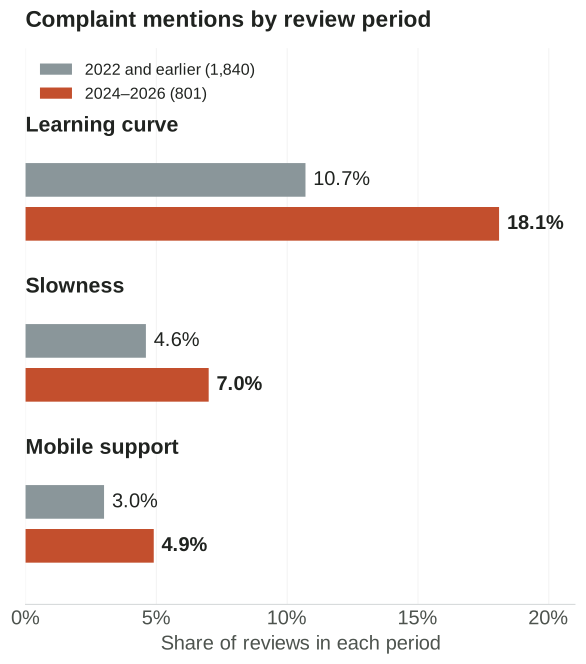
| Complaint | 2022 and earlier (1,840 reviews) | 2024 to 2026 (801 reviews) |
|---|---|---|
| Missing features | 19.9% | 22.1% |
| Learning curve | 10.7% | 18.1% |
| Bugs and reliability | 11.2% | 9.4% |
| Integrations | 9.7% | 10.7% |
| Price | 7.7% | 8.2% |
| Slowness | 4.6% | 7.0% |
| Mobile support | 3.0% | 4.9% |
The two periods contain different mixes of tools and reviewers. These sample differences do not show that a particular product became harder to use or explain why the percentages changed.
What this means when you choose a tool
- 1
Test it with the least technical person
Ask a client or a non-technical teammate to send a report without help. Ease of use is what reviewers value most, and a useful check during your own trial.
- 2
Check the integrations you need today
Integrations are the second most praised quality and a common complaint. Confirm the exact tool and workflow, not just the logo.
- 3
Try it on a phone
The recent-review sample contains a higher share of mobile complaints. Test the devices and platforms your own users need.
- 4
Count the real price
Price appears in 6.6% of reviews, and in 13.2% of mobile bug reporting reviews. Price it for your team size and platforms.
Where Bopmigo fits
We built Bopmigo around the top of these lists: a Feedback window simple enough for clients and real users, reports that arrive complete with a short follow-up when something is missing, websites and mobile apps on every plan, and one flat price with unlimited teammates on Team. Integrations with Slack, Linear and Jira are on the way; today reports go to your inbox, your email, or email only.
Method
- Sources: public reviews on G2 (1,743), Capterra (1,136), WordPress.org (652), the Atlassian Marketplace (262) and TrustRadius (134), collected in November 2026.
- Tools: 44 tools across website feedback, mobile bug reporting, feature requests, surveys, session replay and creative proofing. Reviews date from 2011 to 2026.
- Tagging: complaint topics use keyword tags; praise topics use keyword matches in the positive-review text. The collection was spot-checked by reading samples.
- Category table: 3,919 reviews fall into the six categories shown. Eight reviews from four uncategorized tools are included in the overall totals but excluded from the category table.
- Percentages: share of all 3,927 reviews that mention a topic, unless a row says otherwise. Ratings average the 3,842 reviews that include one.
Limits
- Review sites over-represent people who were asked to review, often happy customers.
- Keyword tagging misses some mentions and catches a few false ones; treat small differences as noise.
- Tools with many reviews weigh more in the totals than tools with few.
- Bopmigo is one of the tools in this market; we’ve kept our own product out of the data.
Questions
Can I cite this research?
Yes. Please link to this page as the source: “Bopmigo, What 3,927 reviews of 44 feedback tools say (2026)”.
Which tools were included?
Among others: BugHerd, Userback, Usersnap, Marker.io, Instabug (Luciq), Canny, UserVoice, Productboard, Featurebase, Hotjar, Smartlook, Sentry, Atarim, ruttl, Pastel, Ybug, Ziflow, PageProof and Filestage.
Will you update it?
We plan to refresh the numbers as new reviews come in and note the date at the top.