Is a spreadsheet enough to track customer feedback?
A shared spreadsheet is a fine first home for feedback, and many teams start there. How to set one up so it stays useful, with a column template, and the points where a spreadsheet starts costing more time than it saves.
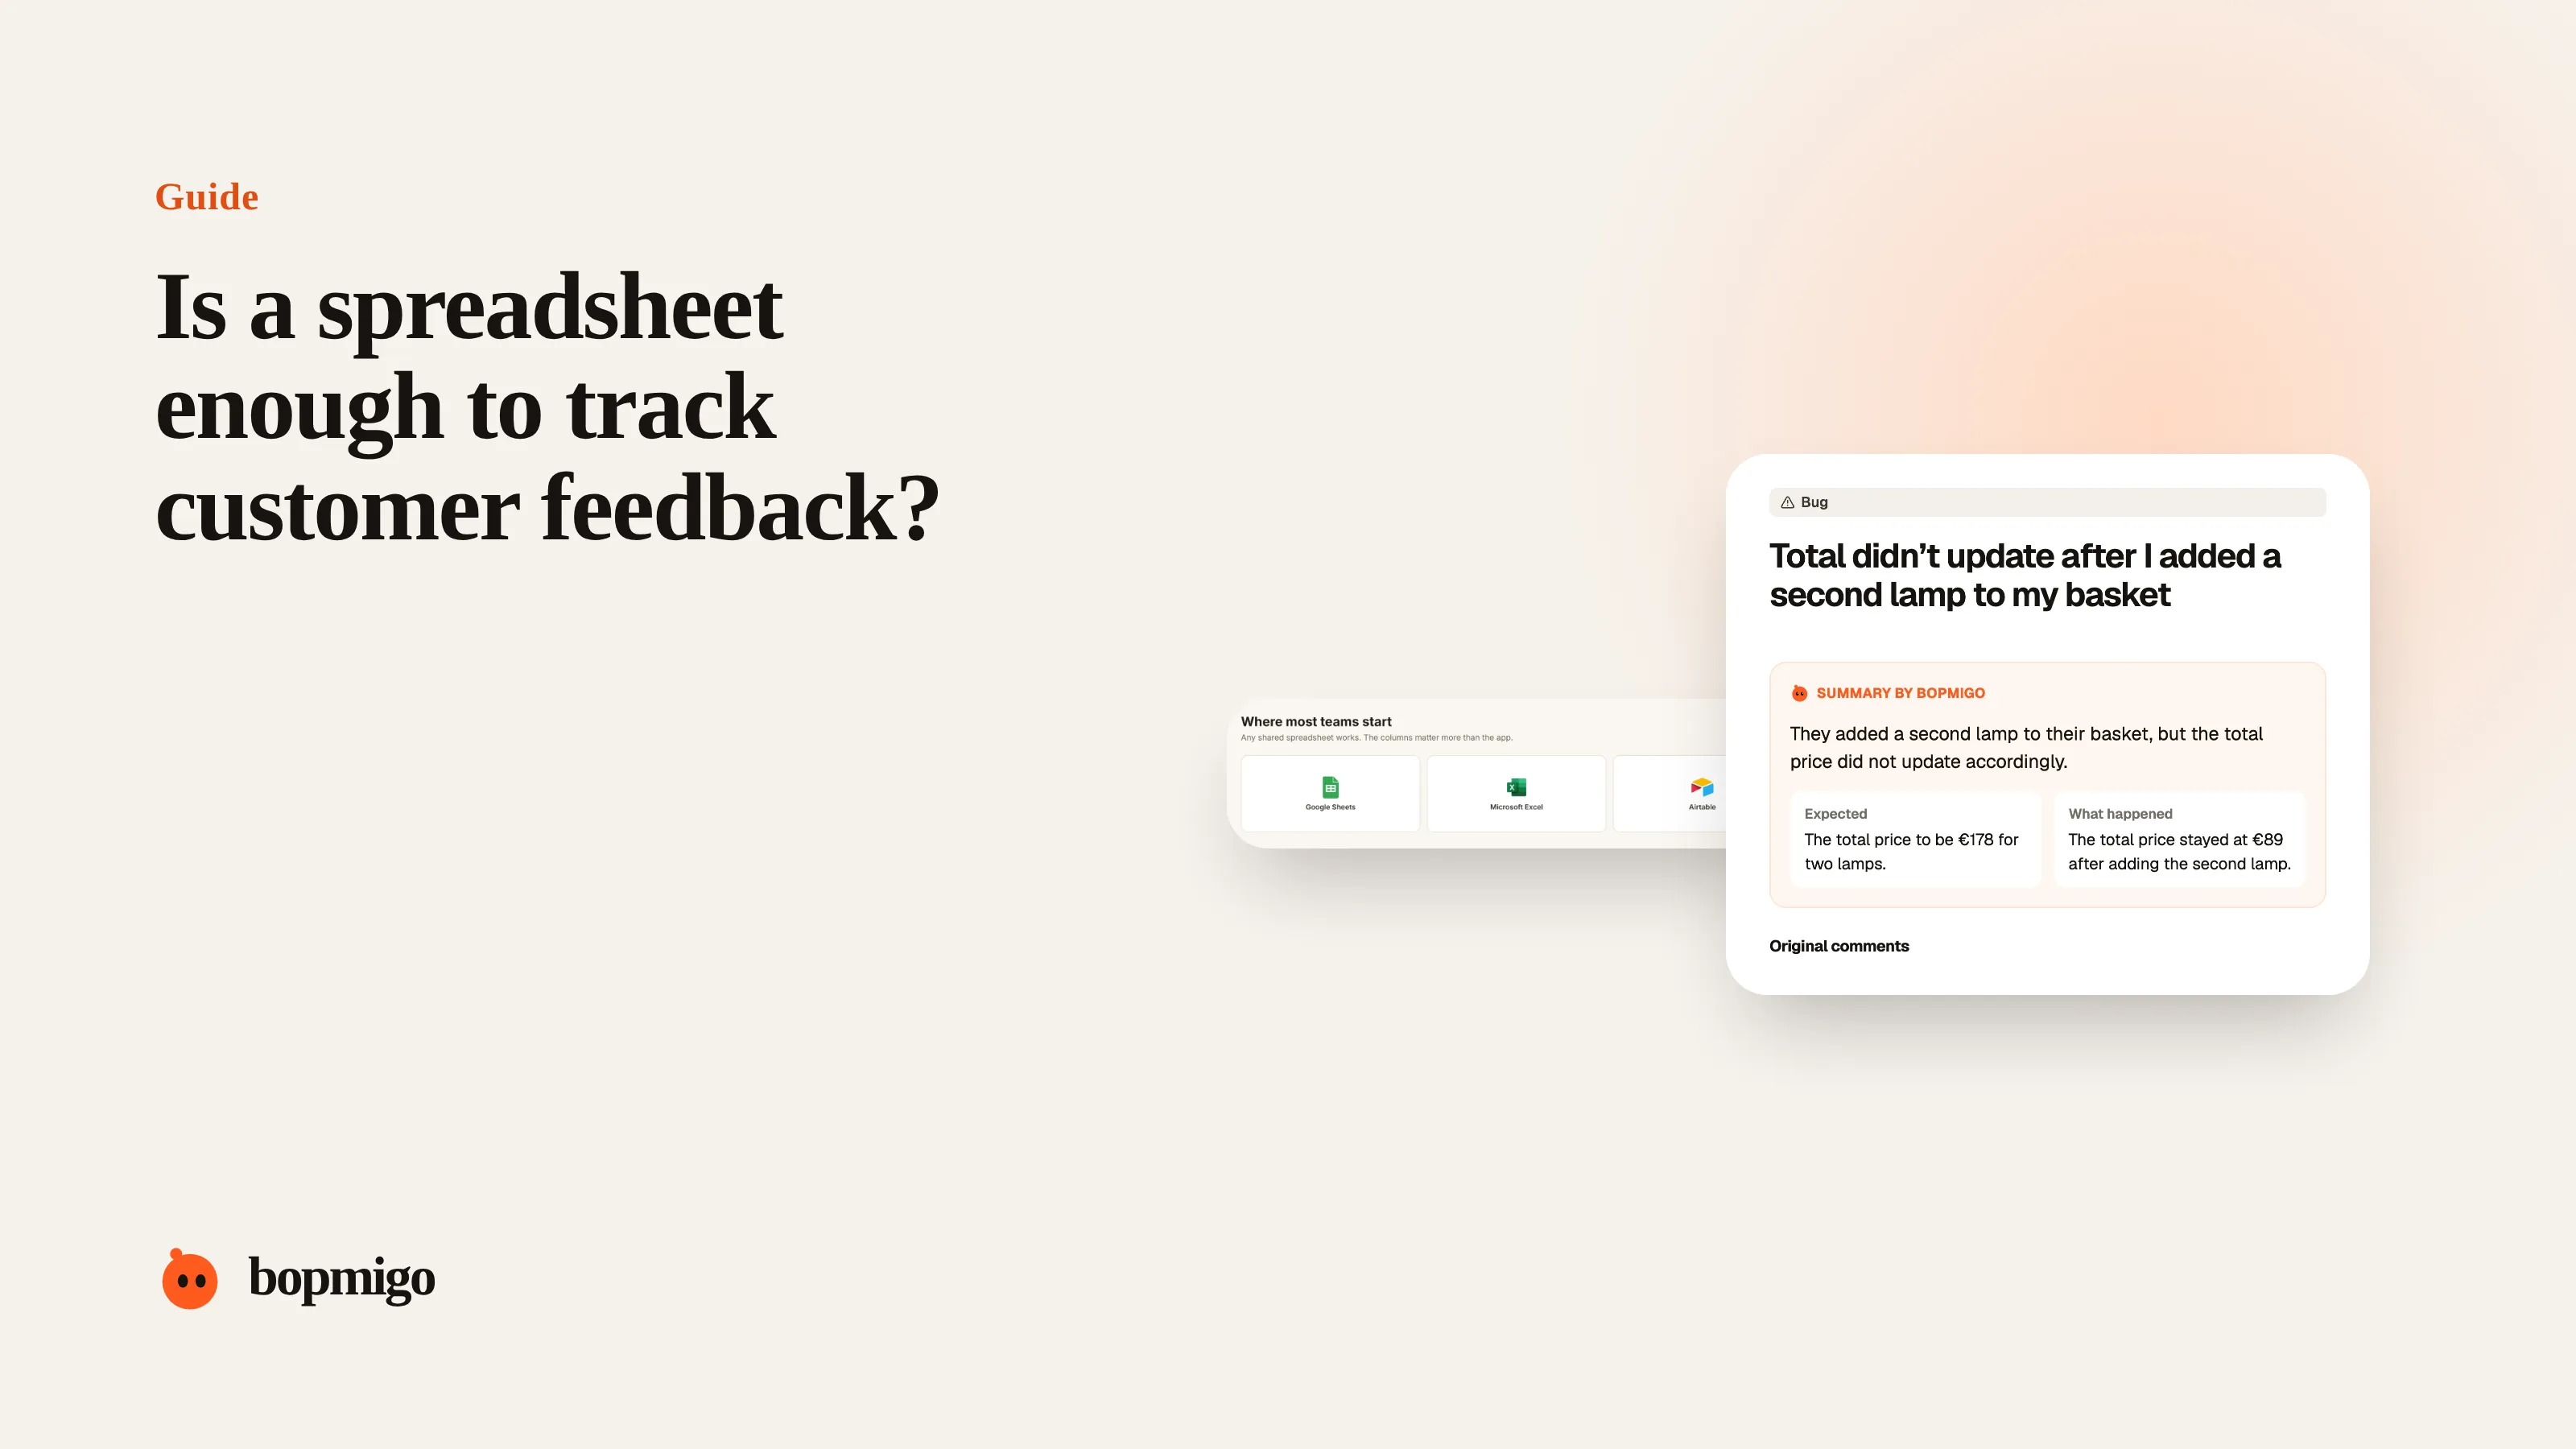
Short answer: yes, at first. A shared spreadsheet is free, everyone knows how to use it, and it forces you to read and sort feedback by hand, which teaches you a lot early on. Set it up with a few consistent columns, keep the customer’s words, and review it weekly. Move on when copying feedback in takes more time than reading it, when you can’t see repeats, or when you need to reply to people from the same place.
A column template that stays useful
| Column | What goes in it | Why |
|---|---|---|
| Date | When the customer sent it | Spot trends after releases |
| Customer | Name or account, and plan | Know who is affected |
| Channel | Email, chat, call, review, in-product | See where feedback comes from |
| Type | Bug, request, question, praise | Sort quickly |
| Where | Page, screen or feature | Group by area |
| Their words | Copied exactly | The detail a summary loses |
| Theme | A short shared name, such as “export missing data” | Count repeats |
| Status | New, decided, in progress, done | Know what’s handled |
| Told them? | Yes or no | Close the loop |
| Link | To the email, call notes or ticket | Find the original |
Keep it from turning into a mess
- One sheet, one row per piece of feedback. Not one row per customer, not one tab per month.
- Fixed choices for Type, Status and Channel. Use dropdowns so spelling doesn’t split your counts.
- A short theme list. Keep themes in a second tab, and pick from it. New themes are fine, but check the list first.
- Freeze the header and filter, don’t delete. Done items stay, filtered out, so you can count later.
- One person checks it weekly. Fix inconsistent rows and merge themes that mean the same thing.
Get answers out of it
A pivot table by Theme, counting unique customers, gives you a ranked list of what people care about most. Filter by date to see what changed since the last release. Filter by Type and Status to find requests nobody has decided on, and rows where “Told them?” is still no.
Where a spreadsheet starts to cost you
| Sign | What it means |
|---|---|
| Copying feedback in takes more than 20 minutes a day | The manual step now costs more than a tool would |
| Rows say “bug on checkout” with no page or device | Context is lost on the way in |
| The same problem has five different theme names | You can’t see repeats without careful cleaning |
| Customers wait days for a reply | Replies happen somewhere else and get forgotten |
| Screenshots live in email attachments | The most useful evidence isn’t with the report |
| Several people edit it at once | Rows get overwritten or duplicated |
A worked example
Picture a five-person SaaS team tracking feedback in a sheet. With a few dozen rows a month it works well. At a couple of hundred a month, someone spends most of Monday copying emails in, and the sheet has nine different theme names for problems with invoices. That is the point to move in-product reports to a feedback tool, keep the sheet for call notes, and review both together each week until the tool covers almost everything.
Formulas that save time
| Question | How to answer it |
|---|---|
| How many people per theme? | A pivot table with Theme as rows and a count of unique Customer values |
| What came in since the last release? | A filter on Date after the release day |
| Who haven’t we told? | A filter on Status “done” and Told them? “no” |
| Which channel brings the most bugs? | A pivot table with Channel as rows and Type as columns |
| What’s growing? | Count per theme this week next to last week, and sort by the difference |
A 20-minute weekly review
- 1
Clean (5 minutes)
Fix empty Type and Theme cells and merge duplicate theme names.
- 2
Rank (5 minutes)
Refresh the pivot table and look at the top five themes and the fastest growing.
- 3
Decide (5 minutes)
Write a status for the top themes: fixing, planned, or not doing, and why.
- 4
Tell (5 minutes)
Reply to everyone in rows marked done but not yet told.
Common questions
Google Sheets, Excel or Airtable?
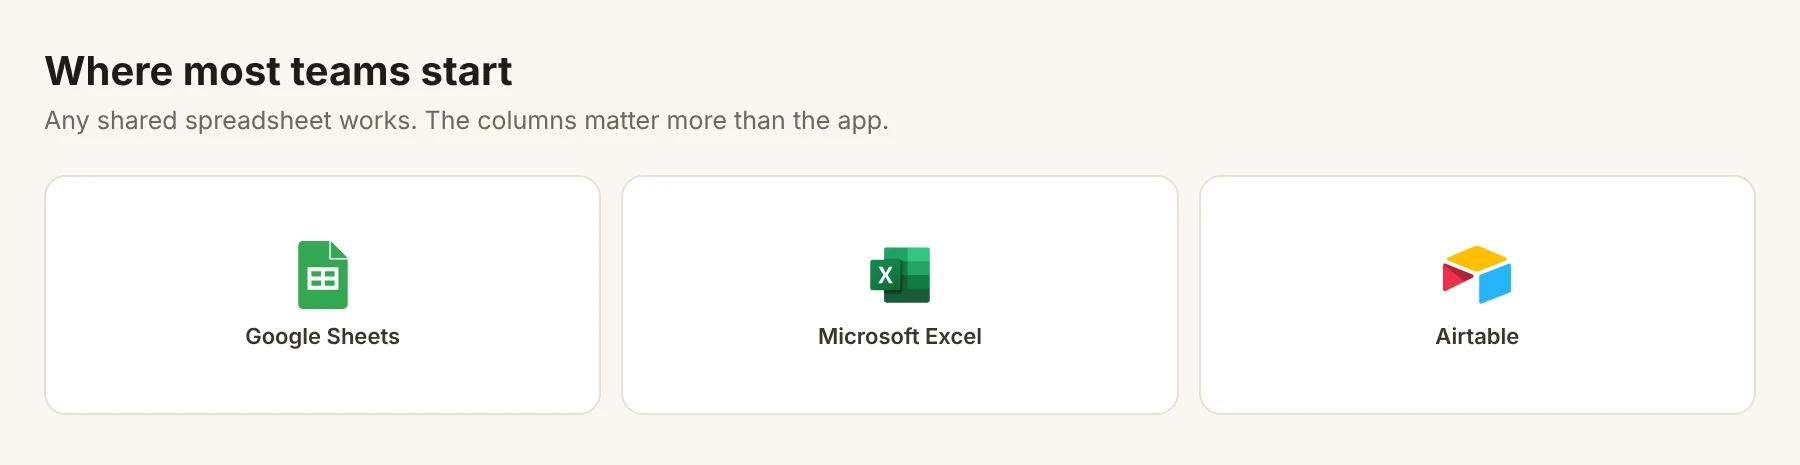
Whichever your team already uses. Airtable adds linked records and forms, which helps if you need them. The columns matter more than the app.
Should I put personal details in the sheet?
Only what you need to follow up, and limit who can open it. Avoid copying card numbers, passwords or health details from messages.
Can I keep the sheet after moving to a tool?
Yes, for channels the tool doesn’t cover, such as calls. Keep the same themes in both.
More on this: bring scattered feedback into one place and should you build your own feedback widget?.
How Bopmigo helps
Bopmigo fills in most of the spreadsheet for you. Each report arrives with the date, the person, the page, the device, a screenshot and their exact words. A short summary makes scanning fast, reports about the same problem are grouped, and the status and your reply live with the report, so “Told them?” is never a separate column. It takes minutes to add to a website, an iPhone app or a Flutter app.