Fix retention before you pay for growth
Paying for installs when most new users leave in the first week mostly buys people who leave. How to read your daily, weekly and monthly active users, the signs you are ready to spend, and a small test that tells you whether paid growth pays back.
Short answer: if more people sign up each month than stay active that month, paying for more sign-ups mostly buys more people who leave. Keep the free channels that already work, such as social posts, community or word of mouth, and put your time into the first week until your retention curve flattens. Then run a small, measured paid test, and judge it by how many of those users are still active a month later, not by installs.
Read your active users correctly
Three numbers tell you most of what you need: people active today (daily actives), in the last 7 days (weekly) and in the last 30 days (monthly). The ratio between them shows how often people come back.
| Ratio | What it means | How to read it |
|---|---|---|
| Daily ÷ monthly | How many monthly users come back on a typical day | Under 10% means most people visit rarely. Apps people use daily sit far higher. |
| Weekly ÷ monthly | How many monthly users come back each week | Under a third suggests many monthly users came once and left. |
| New sign-ups ÷ monthly actives | How much of your audience is brand new | Close to or above 100% means you are replacing people, not growing. |
Here’s how that plays out. A habit-tracking app with 6,000 monthly actives, 1,400 weekly and 300 daily has a daily to monthly ratio of 5%. On an average day, 95 out of 100 of the past month’s users don’t open it. If 5,200 people signed up in the same month, check how many of them were among the 6,000 actives. When most monthly actives turn out to be people who joined that month, the app is filling up and emptying at about the same rate.
Why buying users makes this worse
Paid users usually stay less than people who found you on their own, because they were less sure they wanted the app. When the first week already loses most organic users, paid ones disappear even faster. You also make your numbers harder to read: a jump in sign-ups hides whether retention improved. Spending a little to learn is fine. Spending to grow before the first week works means paying to refill a leaking bucket.
Signs you are ready to spend
- Your retention curve flattens: people still active after week two mostly stay through week six.
- Daily actives grow month on month even without new sign-ups from a viral spike.
- New users from different channels reach your key first-session moment at similar rates.
- You know roughly what an install earns over its first few months, counting the people who leave.
- You have heard, in users’ words, why people leave, and fixed the most common reasons.
Get more from the free channel you have
If most sign-ups come from one free channel, such as social posts, a community you belong to or app store search, that channel already works. Make it bring better users rather than just more. Show what people actually do in the app, not only the hook. Point people toward the feature where your app is strongest. Track retention for people from each post or campaign, using a link or an invite code, and make more of what brings people who stay.
Measure retention by where people came from
| Source | Sign-ups | Still active at Day 30 | What it suggests |
|---|---|---|---|
| Posts showing the app in use | 1,200 | 11% | People knew what they were getting. Make more of these. |
| A viral post with just a joke or trend | 2,600 | 3% | Curiosity installs. Lots of sign-ups, few who stay. |
| Friend invites | 400 | 24% | People who arrive with a friend stay. Make inviting easier. |
| App Store search | 300 | 15% | People looking for what you do. Improve your listing. |
In this example, the source with the most sign-ups brings the fewest people who stay, and the smallest source brings the best ones. Counting sign-ups alone would point the effort in exactly the wrong direction.
Run a small paid test, measured properly
- 1
Set a small budget
Enough for a few hundred installs in one country or audience. Pick the audience that already stays best.
- 2
Tag those users
Make sure you can tell paid users apart in your analytics from the moment they install.
- 3
Wait for Day 7 and Day 30
Install counts after a day tell you very little. Retention and purchases after a month tell you nearly everything.
- 4
Compare with organic users
If paid users stay at half the rate of organic ones, calculate whether purchases still cover the cost.
- 5
Ask them why they installed
A short question in the first session shows whether your ad promised what the app delivers.
A simple payback check
| Number | Example |
|---|---|
| Cost per install | $0.80 |
| Revenue per install in the first 90 days, counting everyone (stayers and leavers) | $0.45 |
| Hosting, store fees and support per install | $0.10 |
| Result per install | $0.45 − $0.10 − $0.80 = −$0.45 |
| Share still active at Day 30 | 8% |
Most of that revenue usually comes from the people who stay. If better onboarding doubles Day 30 retention to 16% and spending per person who stays holds steady, revenue per install rises toward double, without changing the ad at all. That is why retention work often pays back faster than better ads. Run the same check with your own numbers, including revenue from people who left early, before you scale spend.
Where your time goes this month
| Share of time | Spend it on |
|---|---|
| Most | The first session and the first week: finding and fixing why people leave |
| Some | The free channel that already works, aimed at people who will stay |
| A little | One small paid test with a clear Day 30 read-out |
Questions to ask yourself
- How many of last month’s active users signed up last month?
- Does your retention curve flatten, or keep falling?
- Do users from your best channel stay longer than the rest?
- What would each install need to earn, counting people who leave, for paid growth to break even?
- What do people who leave in week one say when you ask them?
Common questions
Isn’t growth itself a signal to investors?
Sign-ups help get attention, but anyone looking closely will ask about retention. Strong retention with modest sign-ups is a better story than the reverse.
My app went viral. Should I spend while there’s momentum?
Spend time, not money. Momentum fades. Use the attention to learn from the many new users why they stay or leave.
How long should I focus on retention before spending?
Until the curve flattens and the most common reasons people give for leaving are fixed. For most young apps that is weeks of focused work, not months.
What if I can’t reach people who already left?
Ask people while they are still in the app, at the screens where they stall. That catches the next wave before it leaves.
More on this: how to improve Day 7 retention, why users sign up and never come back, and how to improve social app retention.
How Bopmigo helps
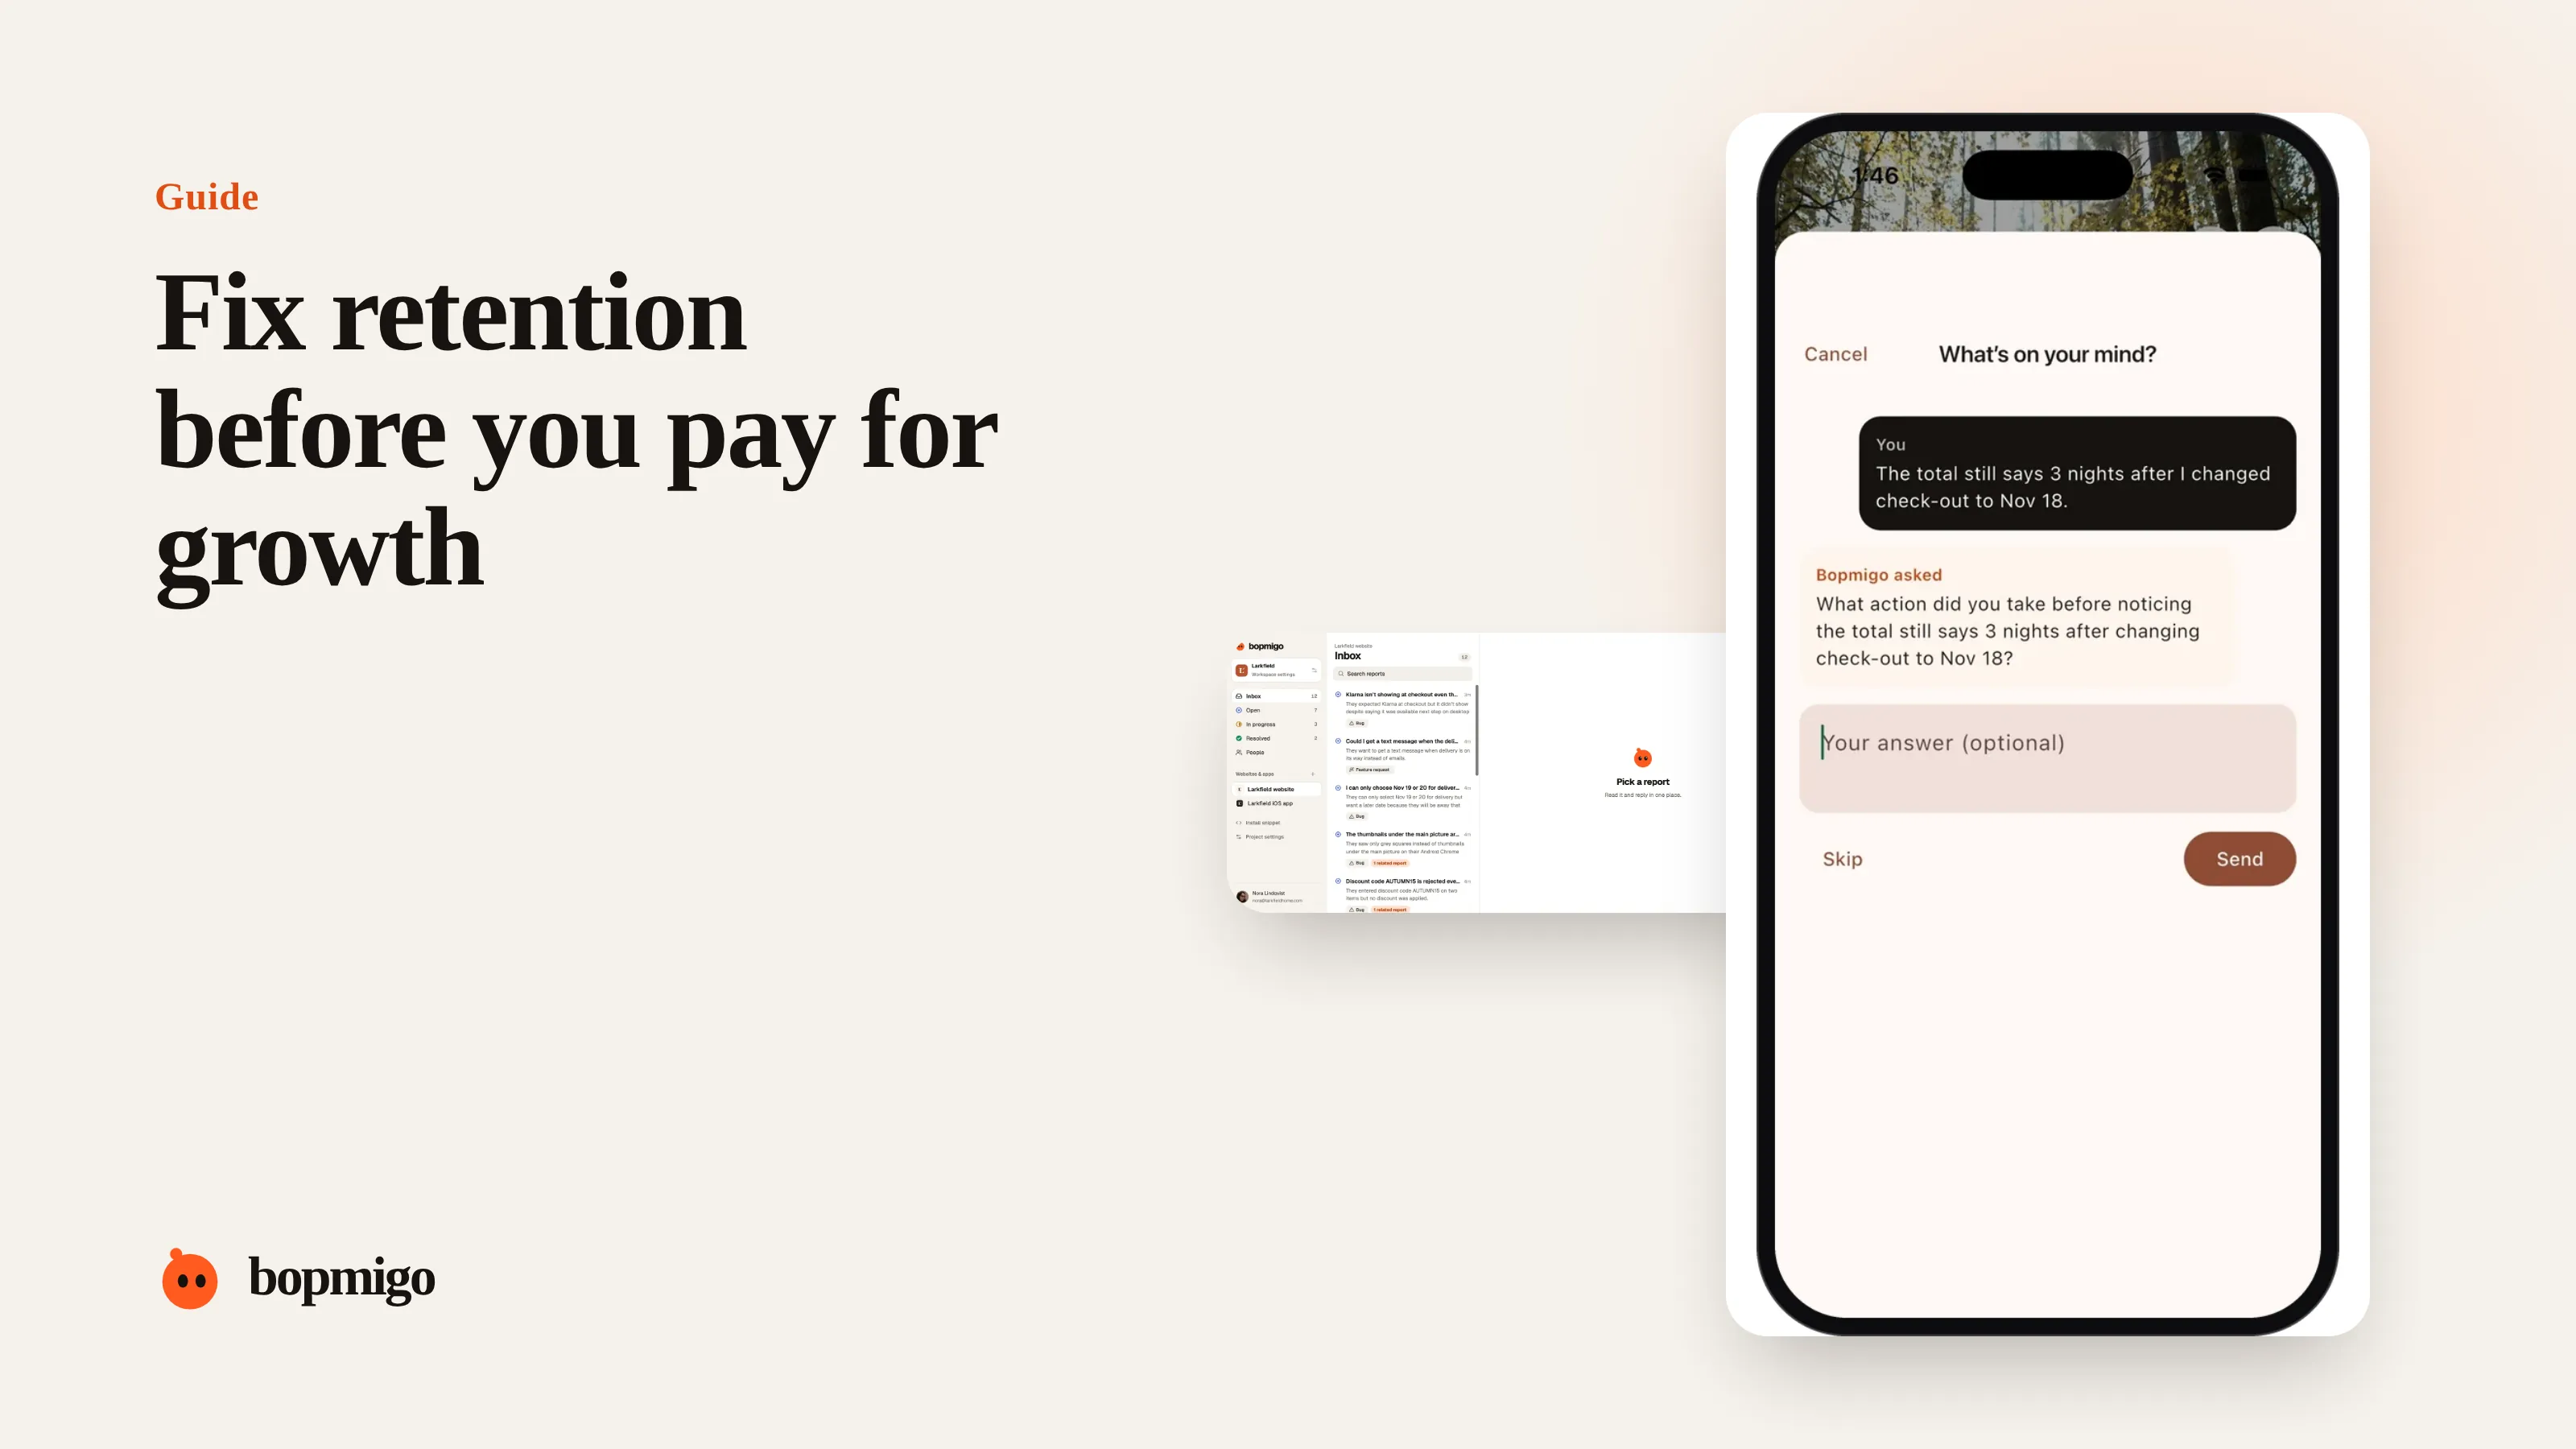
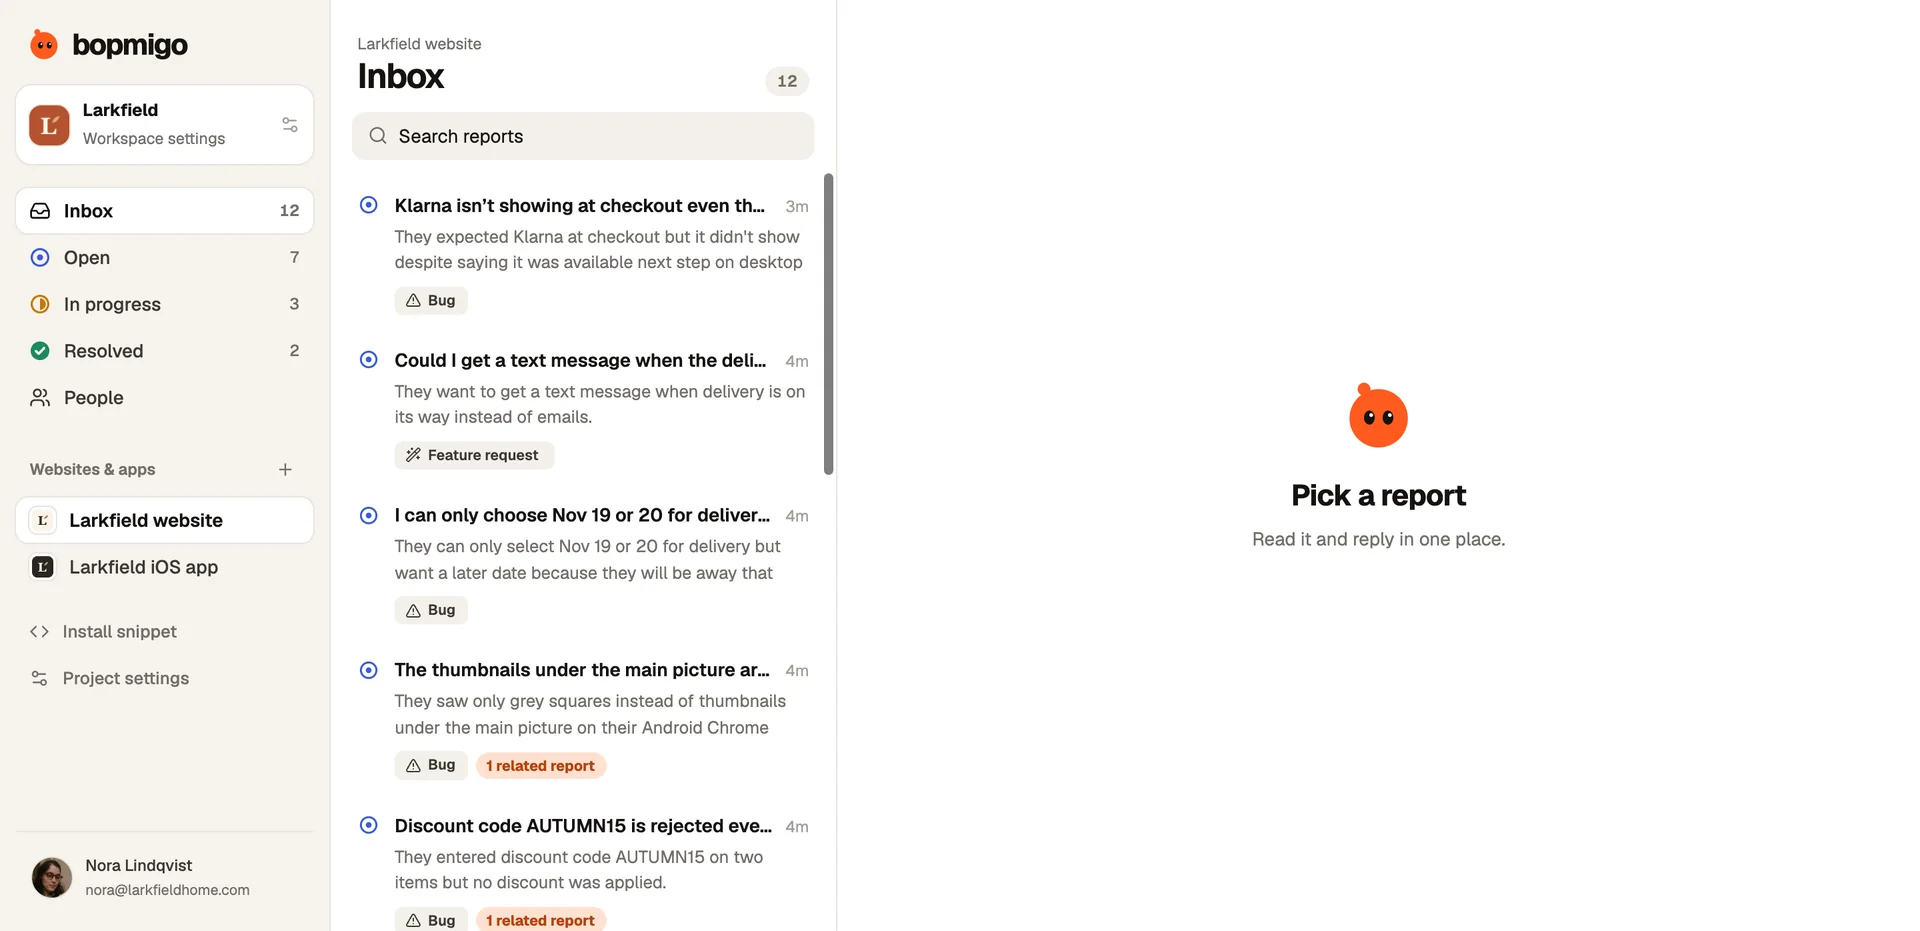
Before you spend on growth, you need to know why people leave. Bopmigo adds a short way for users to tell you, inside your iPhone, Android, Flutter or web app, what they hoped for and what stopped them. Answers from many people about the same thing are grouped, so the most common reason is obvious, and you can reply in the app.